Relational → tables → set of tables- has rows and columns
rows- tuples columns- attributes
While mining databases, we can search for trends or data patterns
Example 1. Analysing customer data to predict the credit risks of customers
2. analysing sales data-(any deviations)
2. Datawarehouse data:
collection of data integrated from different sources with querying and decision making on data In data warehouse, data is stored in multidimensional Structure(datacube )where each dimension is each attribute
3.Transactional Database :
Each record is called as transaction (Sales,flight booking,usen clicks on web page) has transaction ID, lict of other items making trans
from transaction db,we can mine frequent patterns
Characteristics of data :
Dimensionality
Sparcity
Resolution
Types of Datasets
➜Record Data ➜Transactional Data ➜Data matrix ➜Graph based Data ➜Sequential Data ➜Time series Data
Data Attributes
1.Nominal –
Related to name
The values are symbols or names of things
Represent category , code or state also called categorial Attribute.
Ex- Hair Color
2. Ordinal-
Represent a meaningful order or ranking
Not quantity
3.Binary-
Only 2 states or categories are ‘0’ & ‘1’
Boolean (True or False)
1 present/0 absent.
Types: Symmetric – Equal importance , equal weightage for ex-Gender Assymetric – Unequal importance share For ex-HIV Test
4.Numeric-
Quantitative measurable
Represnted by Integer or real values
Types-
a) Interval Scaled– Measurable on equal sized unit have order & can be +ve , 0 , -ve
Allow us to compare and quantity the difference between values
for ex-Tempersture
b) Ratio Scaled- Continuous the measurements on a non-linear scale
Interval scaled are linear scaled measure
Addition and subtraction are allowed but multiplication and division not allowed.
Important Characteristics of Data
Center: A representative or average value that indicates where the middle of the data set is located
Variation: A measure of the amount that the values vary among themselves
Distribution: The nature or shape of the distribution of data (such as bell-shaped, uniform, or skewed)
Outliers: Sample values that lie very far away from the vast majority of other sample values
Time: Changing characteristics of the data overtime
Measures of Central Tendency
A measure of central tendency is a descriptive statistic that describes the average, or typical value of a set of scores.
There are three common measures of central tendency:
mean
median
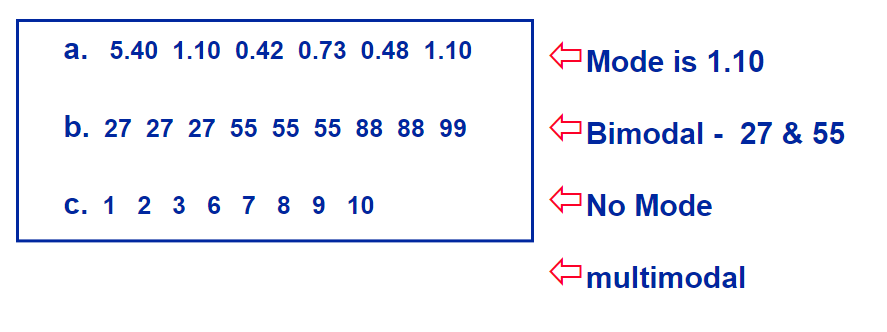
mode
Arithmetic Mean
The measure of center obtained by adding the values and dividing the total by the number of values.
The mean is:
the arithmetic average of all the scores (X)/N
the number, m, that makes (X – m) equal to 0
the number, m, that makes (X – m)2 a minimum
The mean of a population is represented by the Greek letter ; the mean of a sample is represented by X.
Calculating the Mean
Calculate the mean of the following data: 1 5 4 3 2
Sum the scores (X): 1 + 5 + 4 + 3 + 2 = 15
Divide the sum (X = 15) by the number of scores (N = 5): 15 / 5 = 3
Mean = X = 3
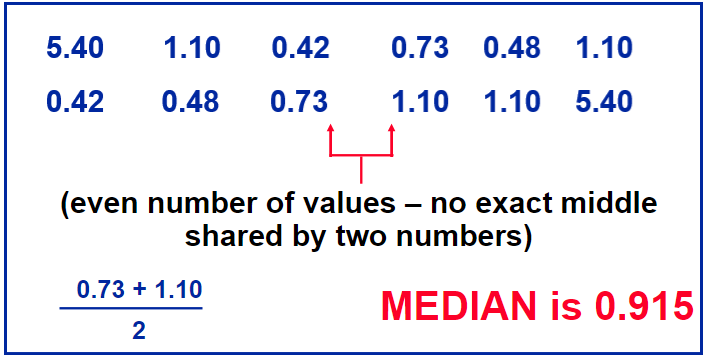
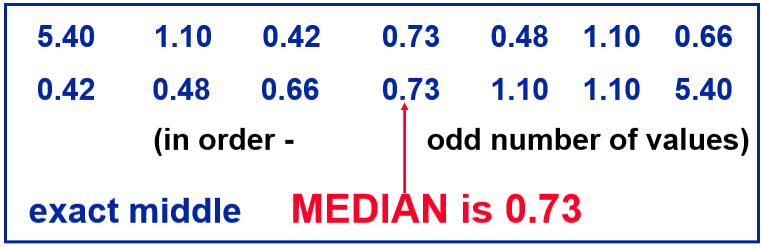
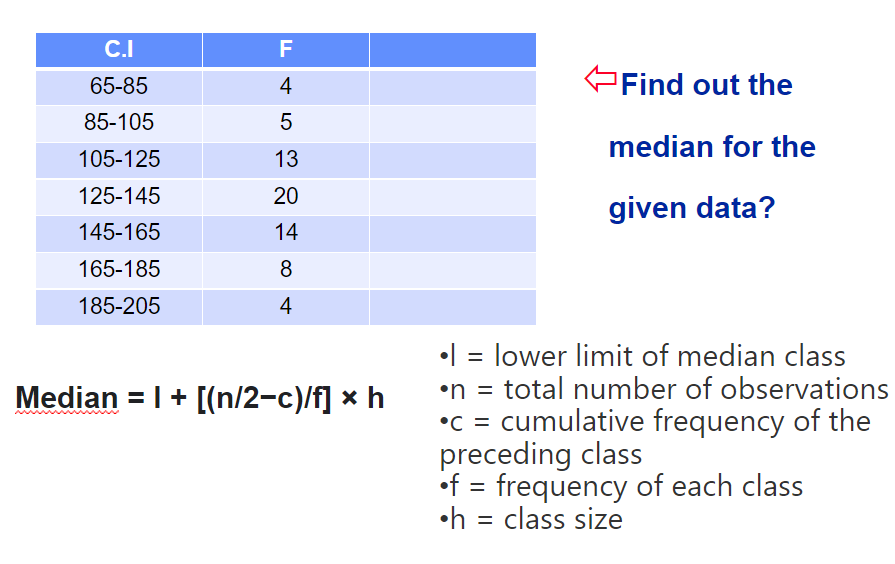
Median
The middle value when the original data values are arranged in order of increasing (or decreasing) magnitude.
How To Calculate the Median ?
Conceptually, it is easy to calculate the median
There are many minor problems that can occur; it is best to let a computer do it
Sort the data
Find the score in the middle
middle = (N + 1) / 2
If N, the number of scores, is even the median is the average of the middle two scores
Median Example
What is the median of the following scores: 10 8 14 15 7 3 3 8 12 10 9